
5 posts tagged with "security"

View All Tags

New GitLab Provider Available

· 6 min read
Technologist and Cloud Consultant

We've released a new StackQL provider for GitLab:

  • gitlab - the GitLab GraphQL API as a read-only SQL surface: projects, groups, users, issues, merge_requests, ci, work_items, security, packages, snippets, boards, analytics, audit, metadata, admin, workspaces, ml and duo (18 services, 244 resources, every one of them SELECT)

The provider is generated from the introspection schema gitlab.com publishes, pinned by content hash and refreshed as a reviewed diff. It works against gitlab.com out of the box and routes to a self-managed instance from an environment variable. It is read-only by architecture: StackQL's GraphQL path is a query path, so there are no INSERT, UPDATE, DELETE or EXEC methods. What it is for is inventory, reporting and cross-provider joins over the GitLab control plane - the questions that otherwise need a script and three API clients.

Connect​

Authentication is a personal access token with the read_api scope, read from GITLAB_TOKEN - the same variable the Terraform GitLab provider uses:

export GITLAB_TOKEN=glpat-...
stackql shell

Public projects and groups on gitlab.com are readable without a token (--auth='{"gitlab": {"type": "null_auth"}}'). For a self-managed instance, set GITLAB_HOST=gitlab.example.com and every query routes there; an explicit WHERE host = ... still wins for addressing another instance in the same session.

Three scopes, one shape​

Resources follow the GraphQL schema. Instance-scoped resources take optional filters only (projects, users, runners); project-scoped resources are prefixed project_ and take the project path; group-scoped resources are prefixed group_ and take the group path. Columns are snake_case, and the nested identity objects GitLab attaches everywhere (author, namespace, milestone, user) are JSON columns one json_extract away.

Every project in a group tree, with activity and visibility signals:

SELECT full_path, visibility, archived,
star_count, forks_count,
open_issues_count, open_merge_requests_count,
last_activity_at
FROM gitlab.groups.group_projects
WHERE full_path = 'gitlab-org' AND include_subgroups = true
ORDER BY last_activity_at DESC;

GitLab connections are Relay-paginated with a hard page size of 100. StackQL walks the pageInfo cursor chain transparently, so the query above returns the whole tree, not the first page.

Filters are pushed down​

Every scalar or enum argument a GitLab field accepts is a WHERE parameter rendered into the GraphQL query itself, so the API does the filtering. Open merge requests with their approval state and age:

SELECT iid, title,
json_extract(author, '$.username') AS author,
draft, approved, approvals_left, detailed_merge_status,
ROUND(julianday('now') - julianday(created_at)) AS age_days
FROM gitlab.merge_requests.project_merge_requests
WHERE full_path = 'gitlab-org/gitlab-runner' AND state = 'opened'
ORDER BY age_days DESC;

Cycle time over a window (merged_after is a filter, merged_at a column):

SELECT iid, title,
ROUND((julianday(merged_at) - julianday(created_at)) * 24, 1) AS hours_to_merge
FROM gitlab.merge_requests.project_merge_requests
WHERE full_path = 'gitlab-org/gitlab-runner'
AND state = 'merged'
AND merged_after = '2026-09-01T00:00:00Z'
ORDER BY merged_at DESC;

Pipelines and runners​

Pipeline outcomes for a project, and the same across every project in a group by joining the inventory to each project's pipelines (the engine issues one pipelines request per project):

SELECT status, count(*) AS pipelines, ROUND(AVG(duration) / 60.0, 1) AS avg_minutes
FROM gitlab.ci.project_pipelines
WHERE full_path = 'gitlab-org/gitlab-runner'
GROUP BY status;

SELECT p.full_path,
count(*) AS pipelines,
SUM(c.status = 'FAILED') AS failed,
ROUND(100.0 * SUM(c.status = 'FAILED') / count(*), 1) AS failure_pct
FROM gitlab.groups.group_projects p
JOIN gitlab.ci.project_pipelines c ON c.full_path = p.full_path
WHERE p.full_path = 'my-group'
GROUP BY p.full_path
ORDER BY failure_pct DESC;

Runner fleet status for a group, with contact recency (the instance-wide runner listing is administrator-only on gitlab.com; the group and project listings are what a token can read):

SELECT id, description, runner_type, status, paused, contacted_at, upgrade_status
FROM gitlab.ci.group_runners
WHERE full_path = 'my-group'
ORDER BY contacted_at DESC;

Vulnerability reporting​

Findings across a group by severity and state, then the unresolved criticals with their owning project:

SELECT severity, state, count(*) AS findings
FROM gitlab.security.group_vulnerabilities
WHERE full_path = 'my-group'
GROUP BY severity, state;

SELECT json_extract(project, '$.full_path') AS project,
title, report_type, detected_at, web_url
FROM gitlab.security.group_vulnerabilities
WHERE full_path = 'my-group' AND severity = 'CRITICAL' AND state = 'DETECTED'
ORDER BY detected_at;

Membership, and a join across providers​

Group membership with access level is a table:

SELECT json_extract(user, '$.username') AS username,
json_extract(user, '$.name') AS name,
json_extract(access_level, '$.string_value') AS access_level,
expires_at
FROM gitlab.groups.group_group_members
WHERE full_path = 'my-group';

which makes the offboarding question a LEFT JOIN against the identity provider - GitLab members with no active Okta user, computed locally by the SQL engine after registry pull okta:

SELECT json_extract(m.user, '$.username') AS gitlab_username,
json_extract(m.user, '$.name') AS gitlab_name,
o.status AS okta_status
FROM gitlab.groups.group_group_members m
LEFT JOIN okta.user.users o
ON lower(json_extract(o.profile, '$.login')) = lower(json_extract(m.user, '$.username') || '@example.com')
AND o.subdomain = 'my-okta-org'
WHERE m.full_path = 'my-group'
AND (o.status IS NULL OR o.status != 'ACTIVE');

How it is built​

  • The selection set for every resource is generated by one policy from the schema: all scalar and enum fields of the node type plus a fixed allowlist of nested identity objects. The query text and the response schema come from the same field list, so DESCRIBE always matches what the wire returns.
  • GitLab enforces a query complexity limit (200 anonymous, 250 authenticated on gitlab.com). Every generated query is scored against the live limit as a build gate; the one node type that exceeded it (merge requests, at 245) was trimmed by measured per-field cost, protecting the approval and merge-state columns, to 190.
  • A handful of resolvers time out on large result sets or answer anonymous callers with a server error. Those fields are excluded by a recorded policy entry rather than left to fail whole pages.
  • all_services.csv in the repository records which schema field backs every resource and method, and regeneration fails when a mapping moves, so resource names stay stable between provider versions.

Premium-tier fields (issue weight, health status, epics) read back as null on the free tier, and the schema is gitlab.com's, so an older self-managed instance may reject fields it does not serve.

Get started​

Pull the provider from the public registry:

registry pull gitlab;

Provider docs are at gitlab-provider.stackql.io. Let us know what you build. Star us on GitHub.
Add continuous cloud audit to your CI/CD in ten minutes

· 6 min read
Cloud Consultant and AWS Community Builder

Cloud security reviews are usually quarterly. Configuration drift happens daily. Between review cycles, buckets get created, firewall rules get loosened, service accounts get reused, and a bucket that was locked down last quarter might not be locked down today. Nothing about the review cadence catches any of it.

Tutorial 1 in this series walked through auditing three clouds with stackql from your terminal. Tutorial 2 showed how the same query engine lets an agent read live state before mutating anything. This guide takes the same audit pattern and puts it in your CI, so the check runs every day, or on every pull request, or every hour, without anyone remembering to run it.

The tool is stackql-audit-action, a GitHub Action that runs an opinionated set of security checks against your cloud accounts and renders findings inline on the workflow run page. Setup is copy-paste. First results in under two minutes.

Query before you mutate: how agents should touch your infrastructure

· 9 min read
Cloud Consultant and AWS Community Builder

The problem with plan, review, apply​

Infrastructure-as-code was designed around human-speed changes: write a plan, review it, apply it, and use state snapshots to know what was managed before. That works best when writers are few and changes are infrequent.

Agents change those assumptions. They run continuously and multiple actors can touch the same resources at the same time. Drift is no longer exceptional. It is unavoidable and relentless.

Canonical IaC tools like Terraform still matter because they represent intent. What's weakened is their ability to reflect current reality. Agents rarely own the whole picture. They usually operate in narrow scopes, working on a slice of infrastructure that other agents, other tools, or humans are also touching. In that world, an agent will regularly encounter infrastructure that was mutated out of band, outside whatever IaC system nominally manages it.

Query-before-mutation handles this case. Read live cloud state, compare it with policy, apply a bounded policy gate, mutate only what is out of policy, then verify. Each run starts from reality rather than a cached view.

The demo takes about ten minutes and uses Google Cloud Storage bucket encryption, but the pattern is provider-agnostic.

Datadog Provider - August 2026

· 6 min read
Technologist and Cloud Consultant

We've released an updated StackQL Datadog provider covering the Datadog v1 and v2 REST APIs together: 18 services, 597 resources and 1658 operations, up from 16 services and 575 operations in the previous release.

What's new​

The previous provider was built from the v2 API alone. Datadog's most-used resources - monitors, dashboards, synthetics, SLOs, hosts, log indexes and pipelines - only exist in the v1 API, so this release merges the two specs into one provider. The v2 surface has also grown considerably since the last build. In summary:

  • The v1 API: monitors (list, search, create, replace, validate, delete), dashboards and dashboard lists, synthetics tests (API, browser and mobile), locations, private locations and global variables, SLOs and SLO corrections, hosts, host totals and host tags, notebooks, log indexes and pipelines, the Azure, PagerDuty, Slack and webhook integrations, and usage metering.
  • New v2 surfaces: cases and case projects, on-call schedules, escalation policies and paging, status pages, incident configuration and responders, feature flags, deployment gates, LLM Observability (projects, datasets, experiments, prompts, annotation queues), Fleet Automation, cloud cost budgets, commitments and tag pipelines, security findings automation, static analysis and SCA, agentless scanning, SIEM historical detections, RUM replay and product analytics, reference tables, org groups and personal access tokens, among others.
  • Site from the environment: the provider addresses https://api.{site}, and site is resolved from DD_SITE when it is set (datadoghq.eu, us5.datadoghq.com, ap2.datadoghq.com, ...), the same convention as the Datadog Agent and API clients. Queries carry no site clause; a WHERE site = '...' still wins for one statement.
  • Pagination and pushdown: cursor-paginated lists (audit events, container images, spans, RUM events, CI events, security signals and findings) are traversed transparently, and a SQL LIMIT is sent as the API's page-size parameter.
  • snake_case surface: columns and WHERE / INSERT keys are snake_case throughout; the few camelCase wire names are aliased.
  • Terraform-aligned authentication: DD_API_KEY and DD_APP_KEY, unchanged.

Service highlights​

ServiceResourcesOperationsWhat it covers
service_management82281incidents, cases, on-call, SLOs, downtimes, events, status pages, change management, error tracking
security93247security monitoring rules, signals and suppressions, findings and automation, vulnerabilities, CSM, agentless scanning, static analysis, SIEM historical detections
organization85207users, roles, permissions, API and application keys, service accounts, teams, org settings, SAML, audit logs, usage
integrations59192AWS, GCP, Azure, OCI, Jira, ServiceNow, Slack, Microsoft Teams, Google Chat, PagerDuty, Opsgenie, webhooks, Cloudflare, Confluent, Fastly, Okta, reference tables
monitoring39100monitors, synthetics, monitor policies, notification rules, service checks
digital_experience3898RUM applications, events, metrics and retention, replay, product analytics, sourcemaps
llm_observability3783projects, datasets, experiments, prompts, annotation queues, evaluators, Model Lab
cloud_costs3773budgets, AWS / Azure / GCP / OCI cost configs, commitments, tag pipelines, cost attribution
software_delivery2071CI pipelines and tests, DORA, deployment gates, workflows, feature flags, code coverage
dashboards1661dashboards, dashboard lists, powerpacks, notebooks, widgets, annotations, scheduled reports
logs1455indexes, pipelines, archives, custom destinations, log metrics, restriction queries, observability pipelines
infrastructure2847hosts and host tags, containers, processes, network devices, app builder, storage management
metrics1842metrics and metadata, tag configurations, timeseries and scalar queries, datasets, DDSQL
apm1027retention filters, spans metrics, scorecards, traces
remote_config627CSM Threats agent rules and policies, WAF rules and policies
actions623action connections, datastores, execution policies
fleet616agents, deployments, schedules, tracers
catalog38software catalog entities, kinds, relations

Authentication​

Export an API key and an application key; set DD_SITE if your organization is not on datadoghq.com:

export DD_API_KEY=...
export DD_APP_KEY=...
export DD_SITE=datadoghq.eu # optional, defaults to datadoghq.com

Monitors​

Every monitor with its state:

SELECT id, name, type, overall_state, tags
FROM datadog.monitoring.monitors;

Only alerting monitors, using the API's own filter:

SELECT id, name, overall_state
FROM datadog.monitoring.monitors
WHERE group_states = 'alert';

Monitor search, with the same syntax as the Manage Monitors page:

SELECT id, name, status, type
FROM datadog.monitoring.monitor_search_results
WHERE query = 'type:metric status:alert';

Dashboards, SLOs and synthetics​

SELECT id, title, layout_type, author_handle, modified_at
FROM datadog.dashboards.dashboards;

SELECT id, name, type, target_threshold, timeframe
FROM datadog.service_management.slos;

SELECT public_id, name, type, status, locations
FROM datadog.monitoring.synthetics_tests;

Users, roles and keys​

v2 resources return the JSON:API row shape - id, type, attributes, relationships - so attributes are one json_extract away. A user audit:

SELECT id,
json_extract(attributes, '$.email') AS email,
json_extract(attributes, '$.status') AS status,
json_extract(attributes, '$.disabled') AS disabled,
json_extract(attributes, '$.created_at') AS created_at
FROM datadog.organization.users;

API keys by age, the input to a rotation policy:

SELECT id,
json_extract(attributes, '$.name') AS name,
json_extract(attributes, '$.created_at') AS created_at,
json_extract(attributes, '$.last4') AS last4
FROM datadog.organization.api_keys
ORDER BY created_at;

Infrastructure and logs​

Hosts reporting to Datadog, and the log indexes with their retention:

SELECT host_name, up, is_muted, apps, last_reported_time
FROM datadog.infrastructure.hosts;

SELECT name, num_retention_days, daily_limit
FROM datadog.logs.indexes;

Audit log​

The audit event list is cursor-paginated and takes the time window as a query parameter:

SELECT json_extract(attributes, '$.timestamp') AS timestamp,
json_extract(attributes, '$.attributes.evt.name') AS event,
json_extract(attributes, '$.attributes.usr.email') AS actor
FROM datadog.organization.audit_logs
WHERE "filter[from]" = 'now-1d';

Security monitoring rules​

Which detection rules are enabled, and who last changed them:

SELECT id, name, type, is_enabled, is_default, updated_at, update_author_id
FROM datadog.security.monitoring_rules
WHERE is_default = false;

Provisioning​

Mutations use the same SQL grammar. v1 resources take their fields as columns; v2 resources take the JSON:API data document. A monitor end to end - validate the definition, create it, replace it (the v1 monitor API updates with PUT), delete it:

EXEC datadog.monitoring.monitors.validate_monitor
@type = 'metric alert',
@query = 'avg(last_5m):avg:system.cpu.user{env:prod} by {host} > 90',
@name = 'High CPU on prod hosts';

INSERT INTO datadog.monitoring.monitors (name, type, query, message, tags)
SELECT 'High CPU on prod hosts',
'metric alert',
'avg(last_5m):avg:system.cpu.user{env:prod} by {host} > 90',
'CPU above 90% on {{host.name}} @slack-ops',
'["team:web", "managed-by:stackql"]';

REPLACE datadog.monitoring.monitors
SET name = 'High CPU on prod hosts', type = 'metric alert',
query = 'avg(last_5m):avg:system.cpu.user{env:prod} by {host} > 95'
WHERE monitor_id = 12345678;

DELETE FROM datadog.monitoring.monitors
WHERE monitor_id = 12345678;

A downtime for a release window, and a role:

INSERT INTO datadog.service_management.downtimes (data)
SELECT '{"type": "downtime",
"attributes": {"message": "release window", "scope": "env:prod",
"monitor_identifier": {"monitor_tags": ["team:web"]},
"schedule": {"start": "2026-09-01T22:00:00Z", "end": "2026-09-01T23:00:00Z"}}}';

INSERT INTO datadog.organization.roles (data)
SELECT '{"type": "roles", "attributes": {"name": "read-only-auditors"}}';

UPDATE datadog.organization.roles
SET data = '{"id": "<role-id>", "type": "roles", "attributes": {"name": "auditors"}}'
WHERE role_id = '<role-id>';

Get started​

Pull the provider from the public registry:

registry pull datadog;

Provider docs are at datadog-provider.stackql.io. Let us know what you build. Star us on GitHub.

Auditing three clouds without writing three scripts

· 6 min read
Cloud Consultant and AWS Community Builder

If you've audited buckets in more than one cloud, you already know what this is like. Three consoles. Three CLIs. Three auth patterns. And a bit of glue code to pull the outputs together every time someone asks a question that spans all three.

The question is usually simple. "Which buckets are public across all our clouds?" You end up running three separate scripts, then reconciling three different output shapes just to give one answer.

This tutorial doesn't make that faster. It replaces it. One query, one view, all three clouds.

What StackQL is, in three sentences​

StackQL is SQL for cloud APIs. You write a normal SQL query, and it makes the API calls to AWS, GCP, Azure, or dozens of other providers to get the answer back as rows and columns.

The important part for this tutorial: it queries the live provider APIs on every run. There's no local database, no cache, no sync job to schedule. What you see is the current state of your cloud, right now.

It exists because someone got tired of writing the same audit logic three times.

What you'll need​

You'll need Docker installed and read-only credentials for whichever clouds you want to audit. All three are optional. If you leave a cloud's credentials blank, it gets skipped.

For AWS, GCP, and Azure, the audit needs a service account or role that can list storage buckets and read their configuration. The audit-action repo has the exact permissions per provider here.

Run the audit​

The tutorial folder has three files: a docker-compose file, an .env.audit.example template, and a README. Grab the folder from docs/tutorials/preview-bucket-01/ in the stackql/stackql repo.

1. Copy the env template

cp ./audit/.env.audit.example ./audit/.env.audit

Then open .env.audit and fill in credentials for whichever clouds you want. The variables are named for what they are: AWS_ACCESS_KEY_ID, AWS_SECRET_ACCESS_KEY, AWS_REGION, AZURE_TENANT_ID, AZURE_CLIENT_ID, AZURE_CLIENT_SECRET, GOOGLE_CREDENTIALS (the service account JSON, on one line), and GOOGLE_ORG_ID.

If you're only auditing one or two clouds, leave the others blank.

2. Pull the StackQL Docker image

docker compose -f docker-compose.bucket.audit.yaml pull

The tutorial pins to stackql/stackql:v0.10.601. The audit uses views under stackql_preview.* which are still evolving, so pinning matters for reproducibility.

3. Run the audit

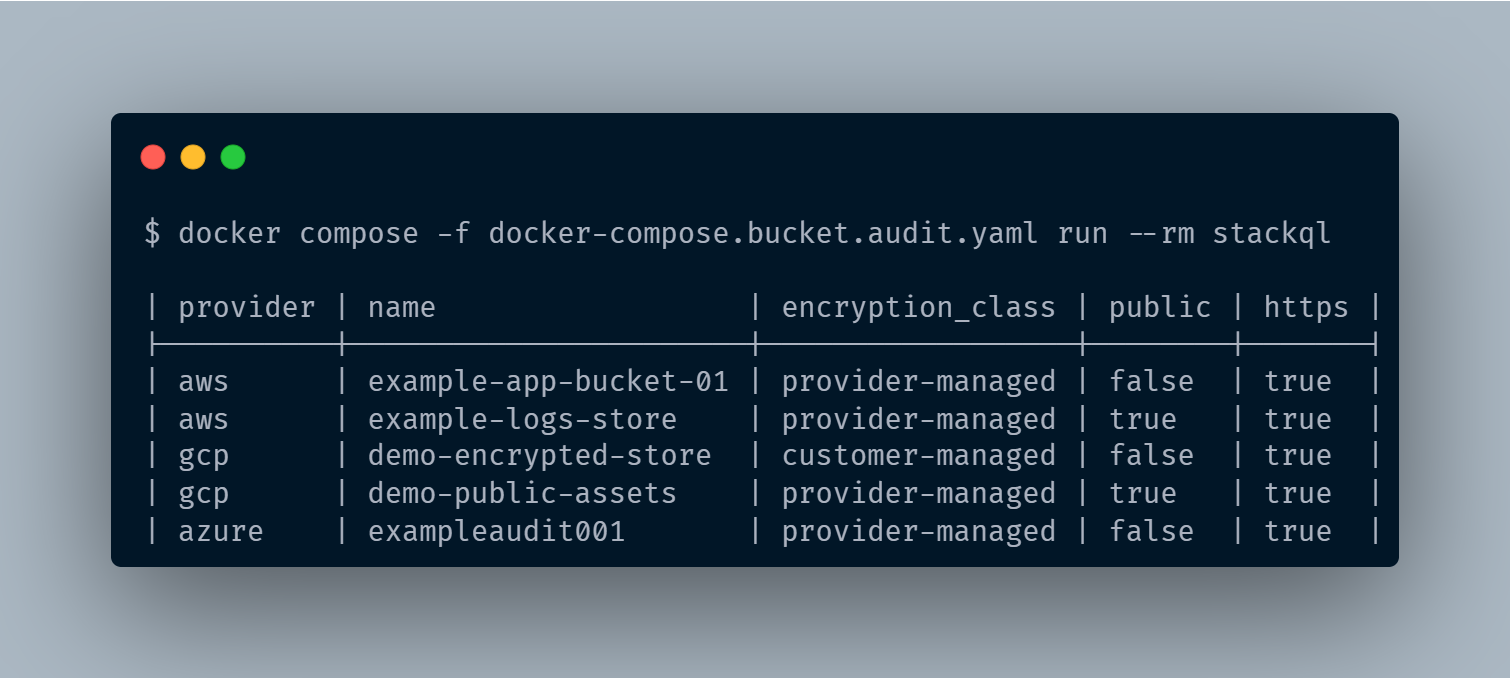
docker compose -f docker-compose.bucket.audit.yaml run --rm stackql

On a modest account this takes about 30 seconds. Output goes straight to your terminal as a table.

What the output tells you​

When the audit finishes, you get a single table printed to your terminal. Something like this (bucket names are placeholders):

Terminal screenshot showing StackQL audit output as a table with columns for provider, bucket name, encryption class, public flag, and HTTPS enforcement. Rows include AWS, GCP, and Azure buckets with a mix of provider-managed and customer-managed encryption, and one public bucket flagged per AWS and GCP.

Example output from the audit. Bucket configuration across three cloud providers in one normalised table.

The point isn't the specific findings. It's the shape.

Three different resource types (S3 buckets, GCS buckets, and Azure Storage Accounts) normalised into one table with the same columns. Encryption class, public flag, HTTPS enforcement. Side by side, for every cloud you provided credentials for.

A few patterns to notice in the table:

  • Public buckets across providers. Filter by public = true and you have the answer to your security team's question, in every cloud, in one place.
  • Encryption side by side. The encryption_class column shows which buckets use provider-managed keys versus customer-managed. Different providers have different naming conventions internally; StackQL normalises them to the same two categories.
  • HTTPS enforcement in one column. Whether it's S3 bucket policies, GCS uniform access, or Azure secure transfer, same column, same values, no translation needed.

This is what SQL for cloud APIs actually delivers. Not just SQL as a query language, but a uniform data model across providers, so you can ask one question and get one answer.

Performance and scope​

StackQL runs each provider's query in parallel using the credentials you provided. There's no local database being populated and no background sync; every run hits the live APIs and returns what's there right now.

On the test account this took about 30 seconds. The query is scoped to one AWS region and one GCP organization, which keeps the API footprint bounded and reflects the current preview default. Streaming output and broader audits (across regions, deeper across resource types) are in flight from the StackQL team.

What this covers today​

Today, this audit covers storage buckets across AWS, GCP, and Azure. One region at a time for AWS, one organization at a time for GCP. Entitlements, IAM, and other resource types are on the roadmap as separate audits under stackql_preview.* and will get their own tutorials as they land.

Where to go next​

github.com/stackql/stackql is the flagship repo. If this tutorial was worth reading, give it a star. It's genuinely the thing that tells the team to build more tutorials like this one, and it helps other engineers with the same three-console problem find the project.

A few natural next steps from here:

  • Run it against your own accounts. The audit works exactly the same way against real credentials. You can start with one cloud and add the others by adding their env vars.
  • Move it into CI. The stackql-audit-action repo has ready-to-use GitHub Actions workflows for all-clouds, single-cloud, deep-audit, and OIDC-authenticated variants. Drop one into your repo, add secrets, and you have a scheduled cross-cloud audit running on every push.
  • Ask questions. The StackQL community Slack is the fastest way. GitHub issues on the flagship repo also work.

More audits are on the way, including entitlements, deeper checks, and larger estates. If there's a specific one you'd find useful, opening an issue is the fastest way to get it on the roadmap.