
4 posts tagged with "observability"

View All Tags

Datadog Provider - August 2026

· 6 min read
Technologist and Cloud Consultant

We've released an updated StackQL Datadog provider covering the Datadog v1 and v2 REST APIs together: 18 services, 597 resources and 1658 operations, up from 16 services and 575 operations in the previous release.

What's new

The previous provider was built from the v2 API alone. Datadog's most-used resources - monitors, dashboards, synthetics, SLOs, hosts, log indexes and pipelines - only exist in the v1 API, so this release merges the two specs into one provider. The v2 surface has also grown considerably since the last build. In summary:

  • The v1 API: monitors (list, search, create, replace, validate, delete), dashboards and dashboard lists, synthetics tests (API, browser and mobile), locations, private locations and global variables, SLOs and SLO corrections, hosts, host totals and host tags, notebooks, log indexes and pipelines, the Azure, PagerDuty, Slack and webhook integrations, and usage metering.
  • New v2 surfaces: cases and case projects, on-call schedules, escalation policies and paging, status pages, incident configuration and responders, feature flags, deployment gates, LLM Observability (projects, datasets, experiments, prompts, annotation queues), Fleet Automation, cloud cost budgets, commitments and tag pipelines, security findings automation, static analysis and SCA, agentless scanning, SIEM historical detections, RUM replay and product analytics, reference tables, org groups and personal access tokens, among others.
  • Site from the environment: the provider addresses https://api.{site}, and site is resolved from DD_SITE when it is set (datadoghq.eu, us5.datadoghq.com, ap2.datadoghq.com, ...), the same convention as the Datadog Agent and API clients. Queries carry no site clause; a WHERE site = '...' still wins for one statement.
  • Pagination and pushdown: cursor-paginated lists (audit events, container images, spans, RUM events, CI events, security signals and findings) are traversed transparently, and a SQL LIMIT is sent as the API's page-size parameter.
  • snake_case surface: columns and WHERE / INSERT keys are snake_case throughout; the few camelCase wire names are aliased.
  • Terraform-aligned authentication: DD_API_KEY and DD_APP_KEY, unchanged.

Service highlights

ServiceResourcesOperationsWhat it covers
service_management82281incidents, cases, on-call, SLOs, downtimes, events, status pages, change management, error tracking
security93247security monitoring rules, signals and suppressions, findings and automation, vulnerabilities, CSM, agentless scanning, static analysis, SIEM historical detections
organization85207users, roles, permissions, API and application keys, service accounts, teams, org settings, SAML, audit logs, usage
integrations59192AWS, GCP, Azure, OCI, Jira, ServiceNow, Slack, Microsoft Teams, Google Chat, PagerDuty, Opsgenie, webhooks, Cloudflare, Confluent, Fastly, Okta, reference tables
monitoring39100monitors, synthetics, monitor policies, notification rules, service checks
digital_experience3898RUM applications, events, metrics and retention, replay, product analytics, sourcemaps
llm_observability3783projects, datasets, experiments, prompts, annotation queues, evaluators, Model Lab
cloud_costs3773budgets, AWS / Azure / GCP / OCI cost configs, commitments, tag pipelines, cost attribution
software_delivery2071CI pipelines and tests, DORA, deployment gates, workflows, feature flags, code coverage
dashboards1661dashboards, dashboard lists, powerpacks, notebooks, widgets, annotations, scheduled reports
logs1455indexes, pipelines, archives, custom destinations, log metrics, restriction queries, observability pipelines
infrastructure2847hosts and host tags, containers, processes, network devices, app builder, storage management
metrics1842metrics and metadata, tag configurations, timeseries and scalar queries, datasets, DDSQL
apm1027retention filters, spans metrics, scorecards, traces
remote_config627CSM Threats agent rules and policies, WAF rules and policies
actions623action connections, datastores, execution policies
fleet616agents, deployments, schedules, tracers
catalog38software catalog entities, kinds, relations

Authentication

Export an API key and an application key; set DD_SITE if your organization is not on datadoghq.com:

export DD_API_KEY=...
export DD_APP_KEY=...
export DD_SITE=datadoghq.eu # optional, defaults to datadoghq.com

Monitors

Every monitor with its state:

SELECT id, name, type, overall_state, tags
FROM datadog.monitoring.monitors;

Only alerting monitors, using the API's own filter:

SELECT id, name, overall_state
FROM datadog.monitoring.monitors
WHERE group_states = 'alert';

Monitor search, with the same syntax as the Manage Monitors page:

SELECT id, name, status, type
FROM datadog.monitoring.monitor_search_results
WHERE query = 'type:metric status:alert';

Dashboards, SLOs and synthetics

SELECT id, title, layout_type, author_handle, modified_at
FROM datadog.dashboards.dashboards;

SELECT id, name, type, target_threshold, timeframe
FROM datadog.service_management.slos;

SELECT public_id, name, type, status, locations
FROM datadog.monitoring.synthetics_tests;

Users, roles and keys

v2 resources return the JSON:API row shape - id, type, attributes, relationships - so attributes are one json_extract away. A user audit:

SELECT id,
json_extract(attributes, '$.email') AS email,
json_extract(attributes, '$.status') AS status,
json_extract(attributes, '$.disabled') AS disabled,
json_extract(attributes, '$.created_at') AS created_at
FROM datadog.organization.users;

API keys by age, the input to a rotation policy:

SELECT id,
json_extract(attributes, '$.name') AS name,
json_extract(attributes, '$.created_at') AS created_at,
json_extract(attributes, '$.last4') AS last4
FROM datadog.organization.api_keys
ORDER BY created_at;

Infrastructure and logs

Hosts reporting to Datadog, and the log indexes with their retention:

SELECT host_name, up, is_muted, apps, last_reported_time
FROM datadog.infrastructure.hosts;

SELECT name, num_retention_days, daily_limit
FROM datadog.logs.indexes;

Audit log

The audit event list is cursor-paginated and takes the time window as a query parameter:

SELECT json_extract(attributes, '$.timestamp') AS timestamp,
json_extract(attributes, '$.attributes.evt.name') AS event,
json_extract(attributes, '$.attributes.usr.email') AS actor
FROM datadog.organization.audit_logs
WHERE "filter[from]" = 'now-1d';

Security monitoring rules

Which detection rules are enabled, and who last changed them:

SELECT id, name, type, is_enabled, is_default, updated_at, update_author_id
FROM datadog.security.monitoring_rules
WHERE is_default = false;

Provisioning

Mutations use the same SQL grammar. v1 resources take their fields as columns; v2 resources take the JSON:API data document. A monitor end to end - validate the definition, create it, replace it (the v1 monitor API updates with PUT), delete it:

EXEC datadog.monitoring.monitors.validate_monitor
@type = 'metric alert',
@query = 'avg(last_5m):avg:system.cpu.user{env:prod} by {host} > 90',
@name = 'High CPU on prod hosts';

INSERT INTO datadog.monitoring.monitors (name, type, query, message, tags)
SELECT 'High CPU on prod hosts',
'metric alert',
'avg(last_5m):avg:system.cpu.user{env:prod} by {host} > 90',
'CPU above 90% on {{host.name}} @slack-ops',
'["team:web", "managed-by:stackql"]';

REPLACE datadog.monitoring.monitors
SET name = 'High CPU on prod hosts', type = 'metric alert',
query = 'avg(last_5m):avg:system.cpu.user{env:prod} by {host} > 95'
WHERE monitor_id = 12345678;

DELETE FROM datadog.monitoring.monitors
WHERE monitor_id = 12345678;

A downtime for a release window, and a role:

INSERT INTO datadog.service_management.downtimes (data)
SELECT '{"type": "downtime",
"attributes": {"message": "release window", "scope": "env:prod",
"monitor_identifier": {"monitor_tags": ["team:web"]},
"schedule": {"start": "2026-09-01T22:00:00Z", "end": "2026-09-01T23:00:00Z"}}}';

INSERT INTO datadog.organization.roles (data)
SELECT '{"type": "roles", "attributes": {"name": "read-only-auditors"}}';

UPDATE datadog.organization.roles
SET data = '{"id": "<role-id>", "type": "roles", "attributes": {"name": "auditors"}}'
WHERE role_id = '<role-id>';

Get started

Pull the provider from the public registry:

registry pull datadog;

Provider docs are at datadog-provider.stackql.io. Let us know what you build. Star us on GitHub.
New ClickHouse Cloud Provider Available

· 5 min read
Technologist and Cloud Consultant

We've released a new StackQL provider for ClickHouse Cloud:

  • clickhouse - the ClickHouse Cloud control plane (api.clickhouse.cloud): organizations, services (lifecycle, scaling, settings, passwords, private endpoints), API keys, members and invitations, organization roles, backups and backup configuration, usage cost and quotas, activities, ClickPipes, the ClickStack surface (dashboards, alerts, sources, webhooks, saved searches), user-defined functions and Managed Postgres (10 services, 44 resources, 139 operations)

The provider covers the Cloud management API only. The ClickHouse server HTTP interface - SQL against a service endpoint and the system.* tables - is a separate surface with separate authentication and is reserved as a future sibling provider, clickhouse_server. What takes two Terraform providers today (the Cloud infrastructure provider and the DBops provider) will be two namespaces in one StackQL session.

Organization scope from the environment

Every resource except organizations is scoped to an organization. The organization ID is a server variable that StackQL resolves from CLICKHOUSE_ORG_ID when it is set, so queries carry no organization clause:

SELECT name, state, provider, region
FROM clickhouse.services.services;

A WHERE organization_id = '...' still takes precedence when you need to address another organization in the same session. Columns and WHERE/INSERT keys are snake_case (created_at, ip_access_list, service_id); the provider maps them to the API's camelCase on the wire.

Estate inventory

State, footprint and scaling configuration for every service in one result set:

SELECT name, state, provider, region,
num_replicas,
min_replica_memory_gb, max_replica_memory_gb,
json_extract(current_scaling, '$.effectiveAutoscalingMode') AS scaling_mode,
idle_scaling, idle_timeout_minutes, clickhouse_version
FROM clickhouse.services.services
ORDER BY provider, region, name;

Organization quotas report usage against limits, which is the quickest answer to "how much room is left":

SELECT quota_code, name, value AS quota_limit, usage
FROM clickhouse.organizations.quotas;

Usage cost by day and entity

The usage cost endpoint returns one row per entity per day in ClickHouse Credits, with the compute, storage, backup and data-transfer components in a metrics object:

SELECT date, entity_type, entity_name, total_chc,
json_extract(metrics, '$.computeCHC') AS compute_chc,
json_extract(metrics, '$.storageCHC') AS storage_chc,
json_extract(metrics, '$.backupCHC') AS backup_chc
FROM clickhouse.organizations.usage_costs
WHERE from_date = '2026-08-01' AND to_date = '2026-08-31'
ORDER BY date, entity_name;

Joined to the services list, the same data answers which stopped or idle services still carried cost in the window:

SELECT s.name, s.state, SUM(c.total_chc) AS chc_in_window
FROM clickhouse.services.services s
JOIN clickhouse.organizations.usage_costs c
ON c.service_id = s.id
WHERE c.from_date = '2026-08-01' AND c.to_date = '2026-08-31'
AND s.state IN ('stopped', 'idle')
GROUP BY s.name, s.state
ORDER BY chc_in_window DESC;

Scaffolding

Provisioning is the usual SQL verbs. A service is an INSERT; the state command (start, stop, awake) is an EXEC; access-list changes are an UPDATE whose PATCH body takes add/remove arrays, passed through as written:

INSERT INTO clickhouse.services.services
(name, provider, region, min_replica_memory_gb, max_replica_memory_gb, num_replicas, idle_scaling, idle_timeout_minutes)
SELECT 'analytics-dev', 'aws', 'us-east-1', 8, 8, 1, true, 15;

UPDATE clickhouse.services.services
SET ip_access_list = '{"add": [{"source": "203.0.113.0/24", "description": "office"}],
"remove": [{"source": "0.0.0.0/0", "description": "Anywhere"}]}'
WHERE service_id = '<service-uuid>';

EXEC clickhouse.services.services.update_state
@serviceId = '<service-uuid>',
@command = 'stop';

Organizations that use Custom Roles assign API key roles by ID, so the role lookup and the key creation are one statement, and the generated secret comes back with RETURNING:

INSERT INTO clickhouse.keys.keys (name, assigned_role_ids, state)
SELECT 'finops-reader', '["' || id || '"]', 'enabled'
FROM clickhouse.roles.roles
WHERE name = 'Organization API Reader'
RETURNING json_extract(result, '$.key.id') AS id,
json_extract(result, '$.keyId') AS key_id,
json_extract(result, '$.keySecret') AS key_secret;

Backup configuration is queryable across the estate, and settable per service:

SELECT s.name, b.backup_period_in_hours, b.backup_retention_period_in_hours, b.backup_start_time
FROM clickhouse.services.services s
JOIN clickhouse.backups.backup_configurations b
ON b.service_id = s.id;

Observability as code

ClickStack dashboards, alerts, sources, webhooks and saved searches are resources with full CRUD, so a dashboard definition lives in version control and is applied with an INSERT:

INSERT INTO clickhouse.clickstack.dashboards (service_id, name, tiles, tags)
SELECT '<service-uuid>', 'Service Overview',
'[{"name": "Error rate", "x": 0, "y": 0, "w": 6, "h": 3,
"config": {"displayType": "line",
"select": [{"aggFn": "count", "where": "SeverityText = ''ERROR''"}]}}]',
'["production"]';

and audited with a SELECT:

SELECT d.name, json_array_length(d.tiles) AS tiles, d.tags
FROM clickhouse.clickstack.dashboards d
WHERE d.service_id = '<service-uuid>';

Alerts and webhooks follow the same pattern (clickhouse.clickstack.alerts, clickhouse.clickstack.webhooks), and the organization activity log is a table for audit questions:

SELECT created_at, type, actor_type, actor_details
FROM clickhouse.organizations.activities
ORDER BY created_at DESC;

The data platform estate in one query

Cross-provider joins are ordinary SQL, so ClickHouse Cloud services sit alongside Snowflake warehouses and Databricks clusters in one inventory:

SELECT 'clickhouse' AS platform, name, state, region
FROM clickhouse.services.services
UNION ALL
SELECT 'snowflake', name, state, NULL
FROM snowflake.warehouses.warehouses
UNION ALL
SELECT 'databricks', cluster_name, state, NULL
FROM databricks_workspace.compute.clusters
WHERE deployment_name = '<workspace>';

Authentication

Create an API key pair in the ClickHouse Cloud console (Settings -> API Keys) with the role the queries need - Organization API Reader / Service API Reader for inventory and cost queries, Service API Admin for provisioning - and export three variables:

export CLICKHOUSE_CLOUD_API_KEY=... # Key ID
export CLICKHOUSE_CLOUD_API_SECRET=... # Key Secret
export CLICKHOUSE_ORG_ID=... # organization ID

The API allows a fixed window of requests per key (documented as 10 per 10 seconds); a 429 is the signal to pace wide scans.

Get started

Pull the provider from the public registry:

registry pull clickhouse

Provider docs are at clickhouse-provider.stackql.io. Let us know what you build. Star us on GitHub.

Cross Cloud Queries with StackQL

· 6 min read
Technologist and Cloud Consultant

This exercise will show you how to run a real-time query across your AWS and Google cloud environments. You may do this for inventory analysis, security analysis, or any other reason you can think of. We will use stackql to query the state of your cloud resources across your AWS and Google environments. You can also use stackql to provision, de-provision or manage resources across different cloud and SaaS providers.

The steps we will take are:

  1. Prepare your environment for stackql usage.
  2. Use stackql to provision some resources in cloud. optional
  3. Use stackql to query resources present in the cloud.
  4. Use stackql to tear down resources created in step (2), if any. Important: you must destroy any resources created through this exercise, or you will incur ongoing charges.

Preparation

For this exercise, credentials with privileges against google and aws are required. It is outside the scope of this document to go into great detail on the various topics and options relevant to this. Instead, the below steps provide both: (i) reference to vendor documentation and (ii) suggestions for workarounds to get yourself going.

for old hands

All the materials required for this exercise are:

  1. A current stackql executable.
  2. A Google Service Account Key JSON file, where the corresponding Service Account possesses permissions sufficient to create, interrogate and delete compute block storage.
  3. AWS credentials stored in the traditional AWS_ACCESS_KEY_ID and AWS_SECRET_ACCESS_KEY environment variables, where the corresponding Service Account possesses permissions sufficient to create, interrogate and delete ec2 block storage.

step by step

First, please do the following:

  1. Download and install stackql from our website.
  2. For google:
    • (i) Create and download a Google Service Account Key as per Google documentation. Remember the location of your key file.
    • (ii) You will need to grant the Service Account at least read, list, create, and delete privileges. For more information about google iam and Service Accounts in particular, please consult the documentation. For this exercise, grant your service account the roles/compute.storageAdmin role would be adequate.
  3. For AWS:
    • (i) Create and download AWS user credentials as per AWS documentation. We will require long-lived credentials. In keeping with vendor advice, we strongly recommend against using root user credentials. We have created a dedicated CICD user for this exercise.
    • (ii) Set up the AWS CLI environment variables as per the documentation.
    • (iii) The user will need create / read / delete privileges against ec2 volumes. This can be done though the AWS IAM console in various ways. For example, one can use groups and permission policies. Adding your user to a group with AmazonEC2FullAccess will certainly work, although lesser privileges may be adequate.

Then, create some shell variables:

# you will need to edit the file path as appropriate

GOOGLE_DOWNLOADED_KEY_FILE_PATH="/path/to/your/downloaded/key.json"

AWS_AUTH_FRAGMENT='{ "type": "aws_signing_v4", "credentialsenvvar": "AWS_SECRET_ACCESS_KEY", "keyIDenvvar": "AWS_ACCESS_KEY_ID" }'

GOOGLE_AUTH_FRAGMENT='{ "credentialsfilepath": "'"${GOOGLE_DOWNLOADED_KEY_FILE_PATH}"'", "type": "service_account" }'

export STACKQL_AUTH_CTX='{ "aws": '"${AWS_AUTH_FRAGMENT}"', "google": '"${GOOGLE_AUTH_FRAGMENT}"' }'
Setting up Provider Auth in PowerShell
$GOOGLE_DOWNLOADED_KEY_FILE_PATH = "C:\path\to\your\downloaded\key.json"

$AWS_AUTH_FRAGMENT = '{ "type": "aws_signing_v4", "credentialsenvvar": "AWS_SECRET_ACCESS_KEY", "keyIDenvvar": "AWS_ACCESS_KEY_ID" }'

$GOOGLE_AUTH_FRAGMENT = '{ "credentialsfilepath": "' + $GOOGLE_DOWNLOADED_KEY_FILE_PATH + '", "type": "service_account" }'

$env:STACKQL_AUTH_CTX = '{ "aws": ' + $AWS_AUTH_FRAGMENT + ', "google": ' + $GOOGLE_AUTH_FRAGMENT + ' }'

Start a stackql shell session

To start an interactive shell session, in the same shell you setup your envrioment variables, run:

stackql --auth="${STACKQL_AUTH_CTX}" shell

You can exit at any time with ctrl + C.

Setup and meta queries to get started

StackQL providers are installed from the StackQL Provider Registry using the REGISTRY command. StackQL supports meta queries such as SHOW and DESCRIBE which can be used to explore the available services, resources, fields, and operations available in a given cloud or SaaS provider.

-- see available providers
registry pull list;

-- pull the required providers
registry pull google;

registry pull aws;

-- some the installed providers
show providers;

-- some meta queries
show services in google;

show resources in google.compute;

describe google.compute.disks;

Create block storage (optional)

You will need to replace the items in <ANGLE_BRACKETS>.

-- create a google volume, await and verify creation completes successfully
insert /*+ AWAIT */ into google.compute.disks(
project,
zone,
data__name,
data__sizeGb
)
select
'<YOUR_GCP_PROJECT>',
'australia-southeast1-a',
'my-stackql-demo-disk-01',
'10' ;

-- create an aws volume, operation despatched on a BEST EFFORT basis
insert into aws.ec2.volumes(
AvailabilityZone,
Size,
region)
select
'ap-southeast-2a',
10,
'ap-southeast-2';

Interrogate cloud block storage


-- query one resource from google
select
name,
split_part(split_part(type, '/', 11), '-', 2) as type,
status,
sizeGb as size
from google.compute.disks
where project = '<YOUR_GCP_PROJECT>'
and zone = 'australia-southeast1-a';

-- query the equivalent from aws
select
volumeId as name,
volumeType as type,
status,
size
from aws.ec2.volumes
where region = 'ap-southeast-2';

-- union the equivalent resources across clouds
select
'google' as vendor,
name,
split_part(split_part(type, '/', 11), '-', 2) as type,
status,
sizeGb as size
from google.compute.disks
where project = '<YOUR_GCP_PROJECT>'
and zone = 'australia-southeast1-a'
union
select
'aws' as vendor,
volumeId as name,
volumeType as type,
status,
size
from aws.ec2.volumes
where region = 'ap-southeast-2';

-- create a view for convenience
create view dual_cloud_block_storage as
select
'google' as vendor,
name,
split_part(split_part(type, '/', 11), '-', 2) as type,
status,
sizeGb as size
from google.compute.disks
where project = '<YOUR_GCP_PROJECT>'
and zone = 'australia-southeast1-a'
union
select
'aws' as vendor,
volumeId as name,
volumeType as type,
status,
size
from aws.ec2.volumes
where region = 'ap-southeast-2';

-- select from the newly created view, with ordering
select * from dual_cloud_block_storage order by name desc;

Delete block storage (if required)

This will only work if the disks are deletable. For example, aws.ec2.volumes must have status = available; you can check this with the view we created above.

/* delete a google volume, await and verify creation completes successfully.
One at a time only... */
delete /*+ AWAIT */ from google.compute.disks
where project = '<YOUR_GCP_PROJECT>'
and zone = 'australia-southeast1-a'
and disk = 'my-stackql-demo-disk-01';

-- delete an aws volume, operation despatched on a BEST EFFORT basis
delete from aws.ec2.volumes
where VolumeId = 'vol-049ee07b31aff451a'
and region = 'ap-southeast-2';

Verify the cleanup was successful

select * from dual_cloud_block_storage order by name desc;

That's it for the scripted demo!

Get involved

We Need Your Help!

if you find bugs, want features, have tech questions then go to github.com/stackql/stackql/issues and raise the appropriate issue 🙏

Sumologic Provider for StackQL Now Available

· 2 min read
Technologist and Cloud Consultant

The StackQL Sumologic provider is now available in the public StackQL Provider Registry. Docs are available at sumologic provider docs.

StackQL is an intelligent API client which uses SQL as a front-end language. StackQL can be used for querying cloud and SaaS providers, as well as provisioning and lifecycle operations.

The StackQL Sumo provider can query, create, update and delete Sumologic collectors and sources, view and manage ingest budgets, health events, dashboards, user and account access and activity, and more.

Some example queries include:

SELECT id, name FROM sumologic.collectors.collectors WHERE region = 'au';

or using built-in functions to simplify and format query outputs, such as:

SELECT alive, datetime(lastSeenAlive/1000, 'unixepoch') AS lastSeenAliveUtc,
datetime(lastSeenAlive/1000, 'unixepoch', 'localtime') AS lastSeenAliveLocal
FROM sumologic.collectors.collectors
WHERE region = 'au' AND id = 116208196;

another example...

SELECT id, email,
firstName || ' ' || lastName AS fullName,
isMfaEnabled,
lastLoginTimestamp,
round(julianday('now') - julianday(lastLoginTimestamp), 0) as daysSinceLastLogin
FROM sumologic.users.users WHERE region = 'au';

An example using StackQL with the Sumologic provider to query users and roles and join the results to get a list of users and their roles:

SELECT u.email as email, r.name AS role
FROM sumologic.users.users u
JOIN sumologic.roles.roles r
ON JSON_EXTRACT(u.roleIds, '$[0]') = r.id
WHERE u.region = 'au' AND r.region = 'au';

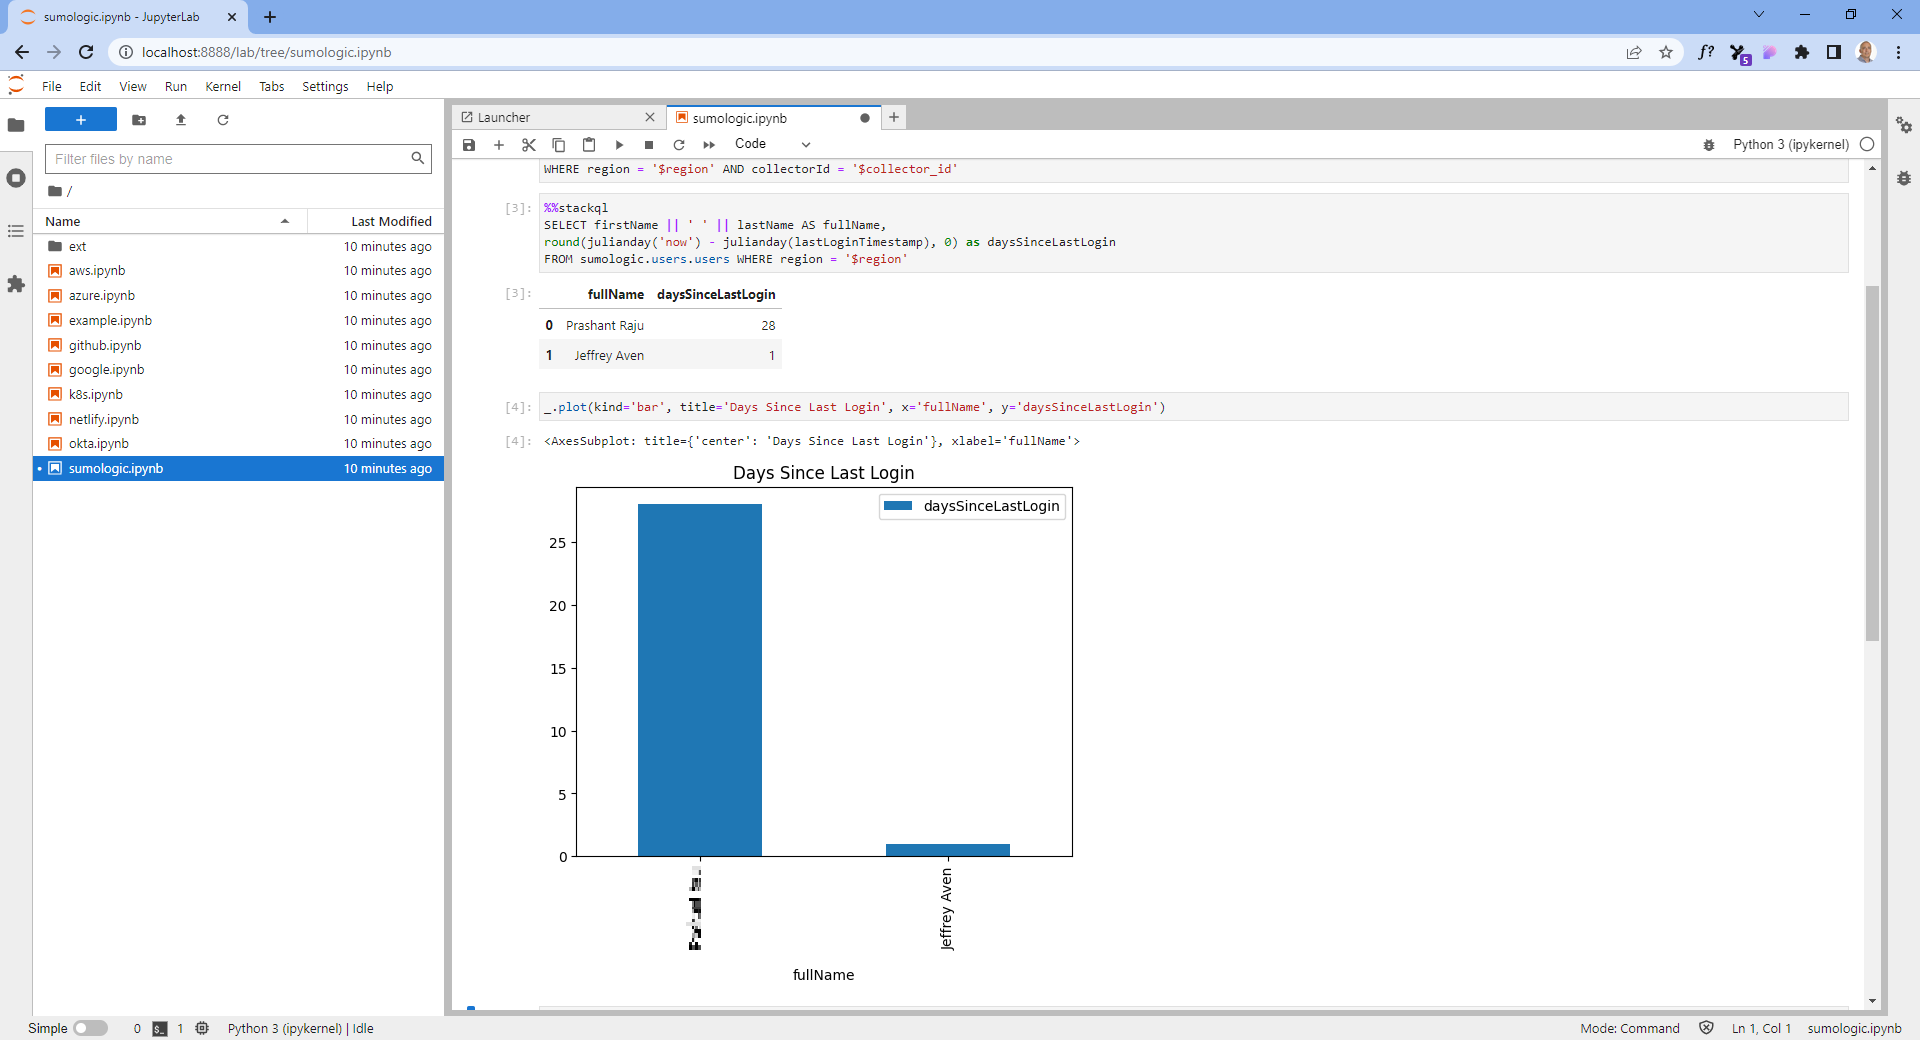
An example using StackQL and Jupyter is shown here (see stackql/stackql-jupyter-demo):

Use StackQL and Jupyter to query SumoLogic

StackQL can also be used to provision objects in Sumologic, the following query can be used to create a collector for instance:

INSERT INTO sumologic.collectors.collectors(region, data__collector)
SELECT 'au',
'{ "collectorType":"Hosted", "name":"My Hosted Collector", "description":"An example Hosted Collector", "category":"HTTP Collection" }';

Let us know what you think!