Cloud and SaaS Visibility with StackQL and PowerBI
stackql is a dev tool that allows you to query and manage cloud and SaaS resources using SQL, which developers and analysts can use for CSPM, assurance, user access management reporting, IaC, XOps and more.
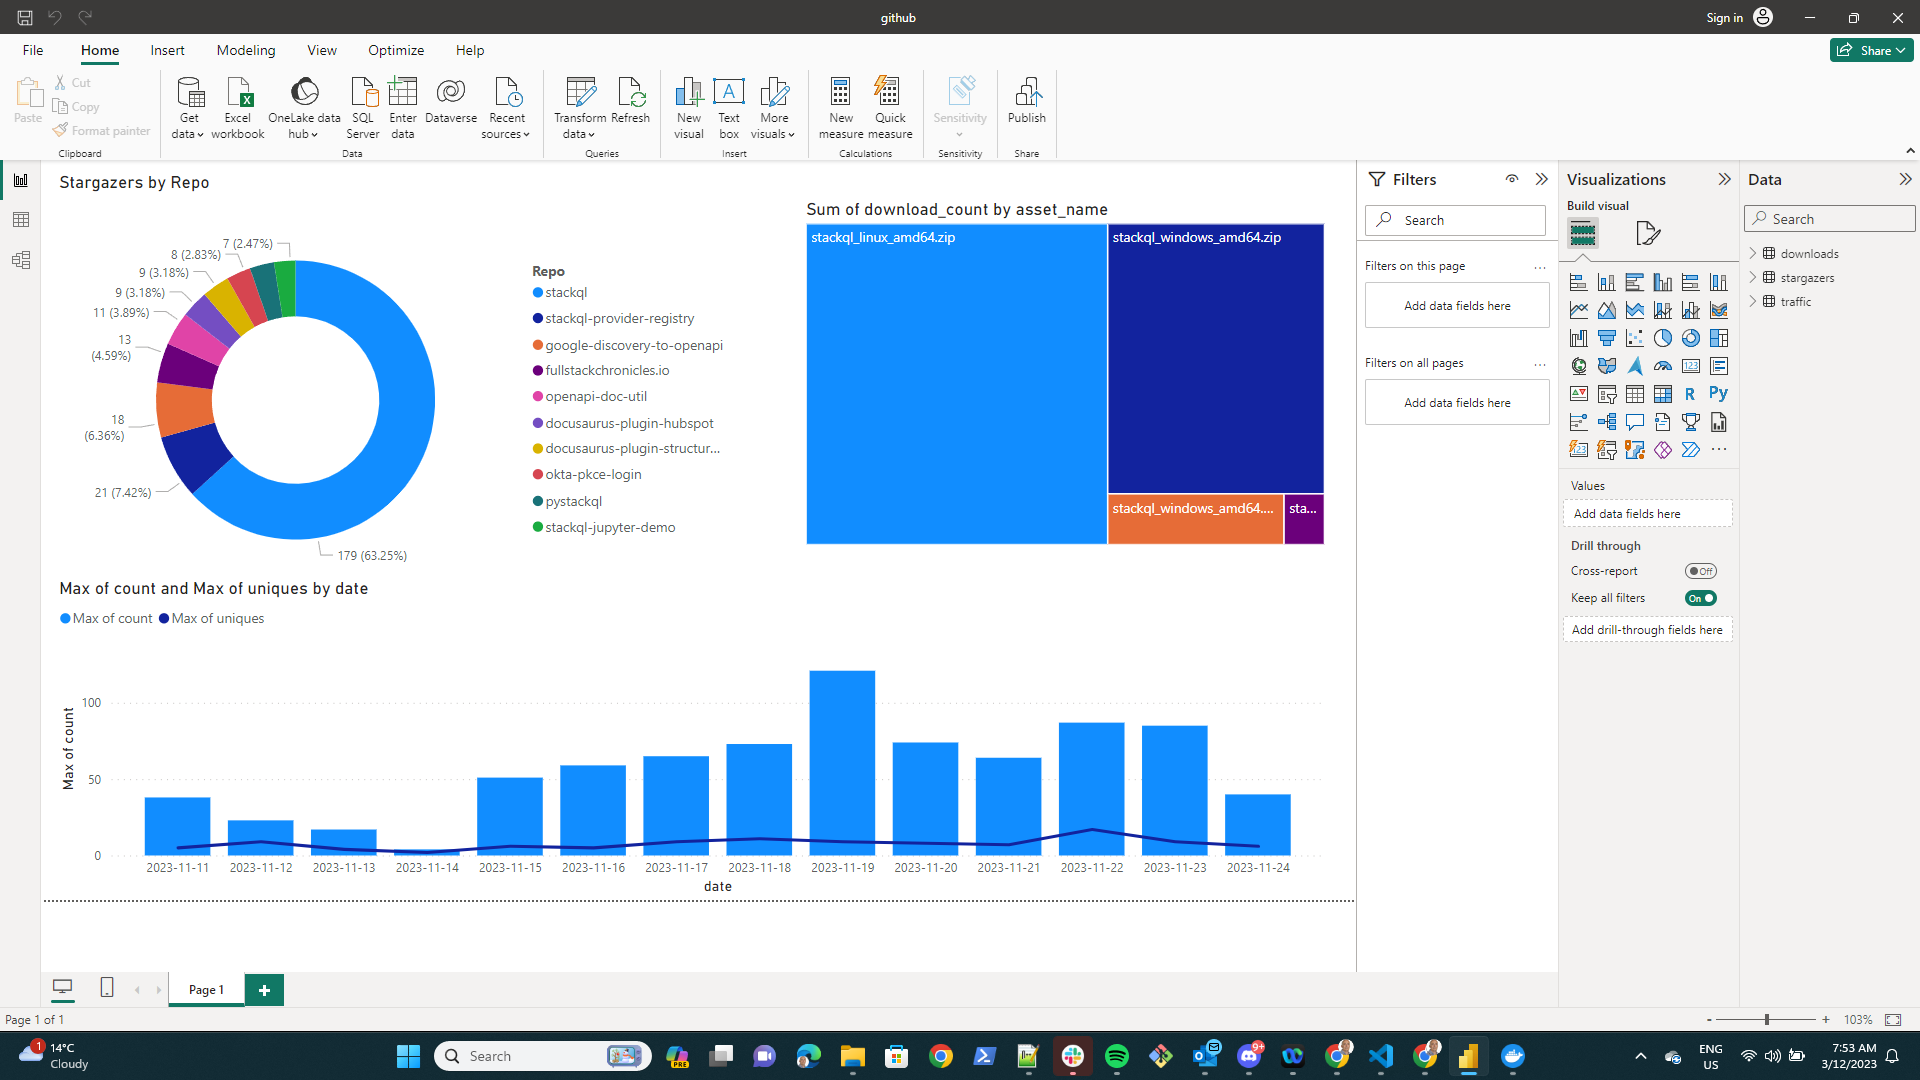
You can leverage the powerful combination of StackQL and PowerBI to create comprehensive dashboard interfaces. These dashboards are perfect for reporting on various aspects such as cloud security, inventory, and configuration.

Quick Start Guide
Set Up StackQL Server
To get started, you can run a StackQL server container on port 7432. Use the following project for easy setup: StackQL Server on GitHub.
Create an ODBC Connection
Next, set up an ODBC connection using the PostgreSQL ODBC driver. You can download the latest driver from the PostgreSQL ODBC Driver Versions. Install this driver on your local machine to proceed.
Integrating with PowerBI
Once your ODBC connection is ready, you can move on to PowerBI. Here’s how you can integrate StackQL queries into PowerBI:
-
Create Data Sources in PowerBI: For each StackQL query that you want to visualize, create a new data source in PowerBI.
-
Test Queries Locally: Before integrating with PowerBI, you can test your StackQL queries locally using
psql. For example:$ psql -h localhost -p 7432 -U stackql -d stackql
psql (14.9 (Ubuntu 14.9-0ubuntu0.22.04.1), server 0.0.0)
Type "help" for help.
stackql=> select name, stargazers FROM
(select name, stargazers_count as stargazers
from github.repos.repos
where org = 'stackql'
and visibility = 'public'
order by stargazers_count desc) t
limit 3;
name | stargazers
-----------------------------------+------------
stackql | 179
stackql-provider-registry | 21
google-discovery-to-openapi | 18
(3 rows) -
Visualize with PowerBI: With your named data sources created, you can now visualize the result sets in PowerBI. Use various visualization tools like bar charts, pie charts, and line charts to create rich and insightful dashboards.
Let us know your thoughts! Visit us and give us a ⭐ on GitHub