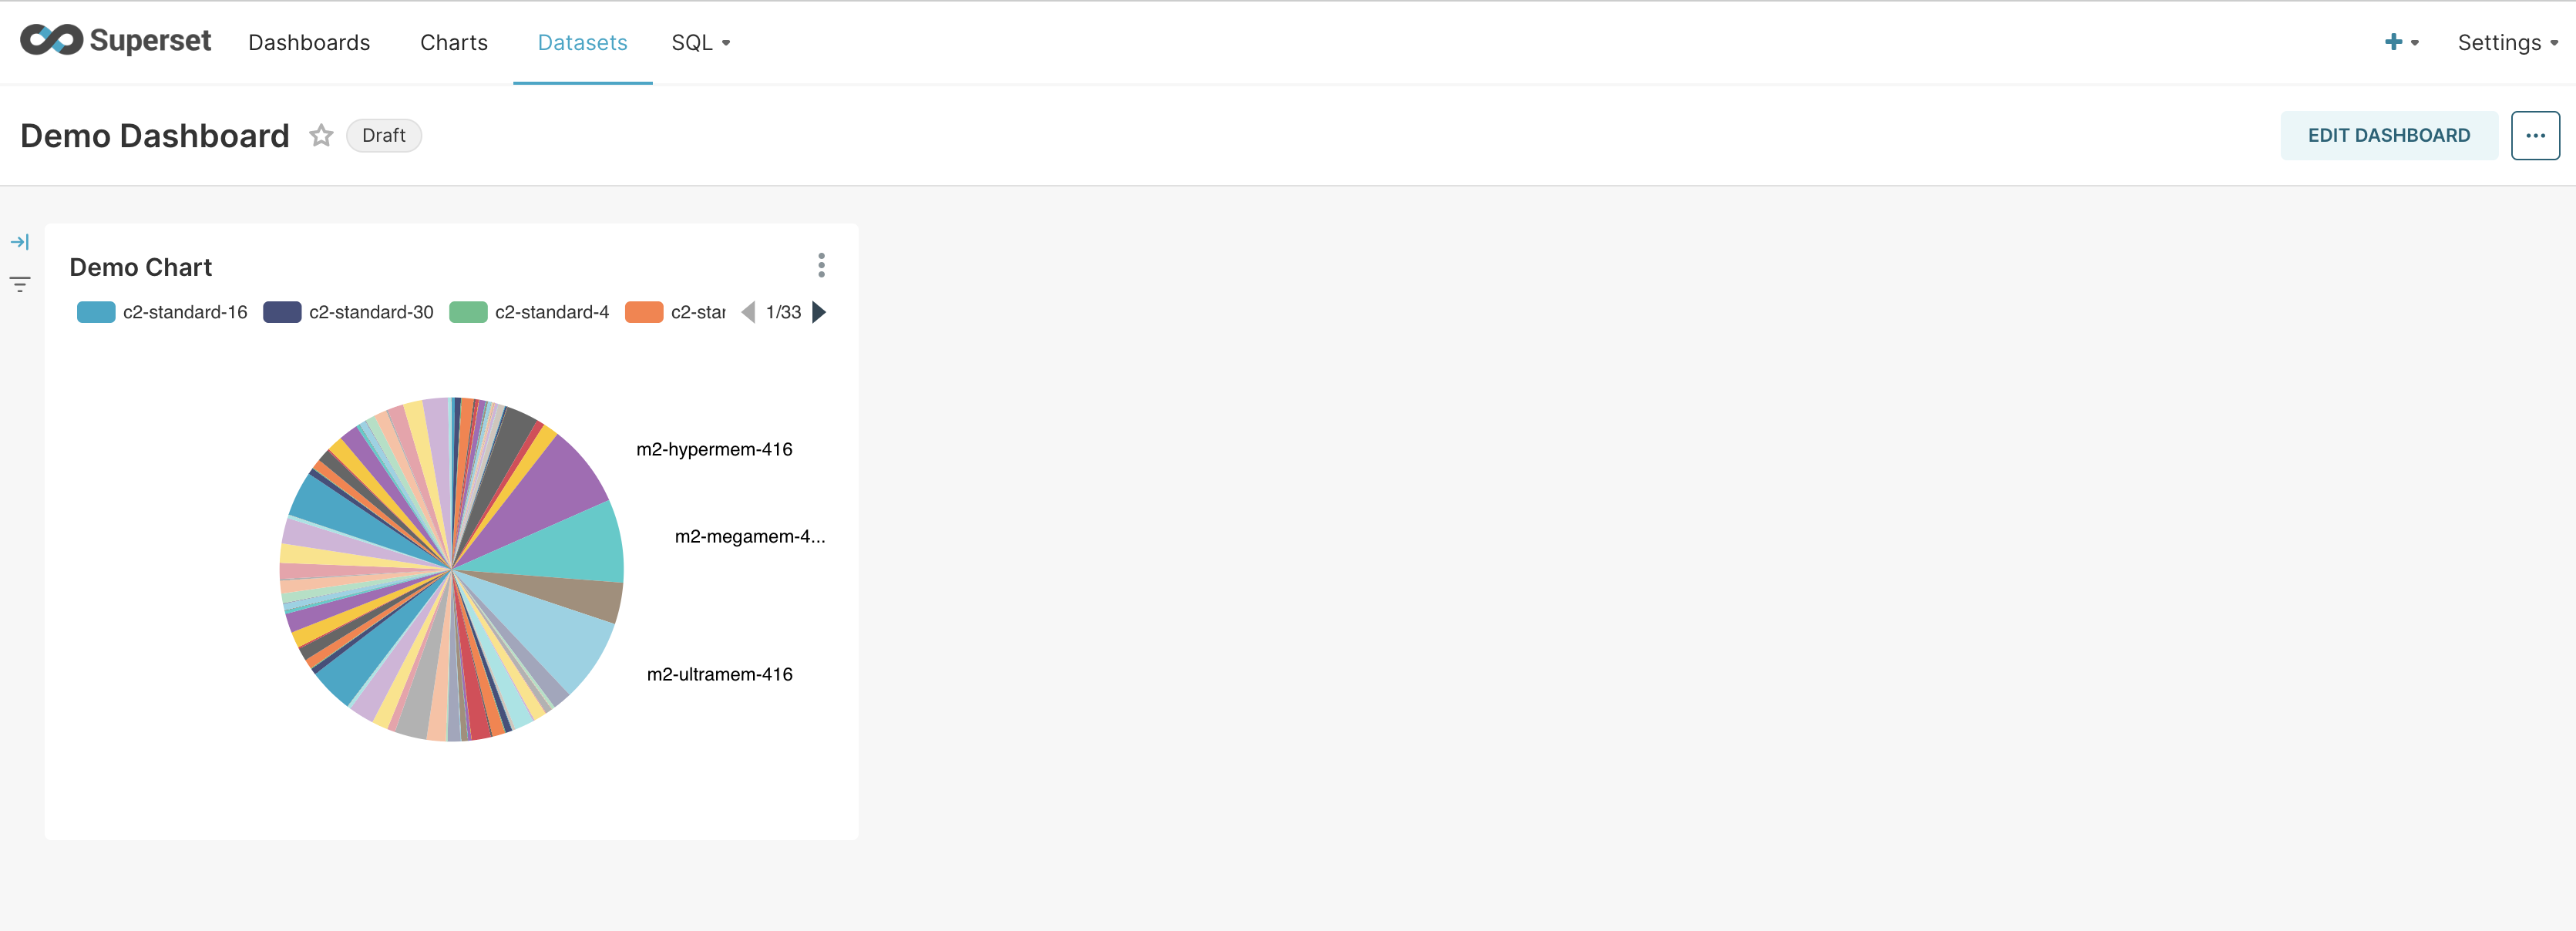
StackQL Superset Dashboards Quickstart
stackql is a dev tool that allows you to query and manage cloud and SaaS resources using SQL, which developers and analysts can use for CSPM, assurance, user access management reporting, IaC, XOps and more.
This quick start guide outlines how to create a superset + stackql dashboard on your laptop using docker desktop, helm, and kubernetes. We certainly do not want to go into depth on superset, a third-party application, so this guide is terse.
Supplying secrets
In this example, we use:
- AWS environment variable credentials as per the AWS CLI.
- Azure environment variables, as per the documentation for the
golangSDK. digitaloceanpersonal access token.githubpersonal access token.googleService Account JSON key.
All of the associated principals must be granted access using provider-specific access controls.
NOTE keep all of these values secret and certainly do not commit into source control. We have supplied examples for numerous providers, and we suggest that you configure only what you need.
Create a file helm/stackql-dashboards/secrets/secret-values.yaml, containing the following, replacing placeholders:
stackql:
  extraSecretEnv:
    AWS_ACCESS_KEY_ID: '<your aws access key id>'
    AWS_SECRET_ACCESS_KEY: '<your aws secret key>'
    AZURE_CLIENT_ID: '<your azure client id>'
    AZURE_CLIENT_SECRET: '<your azure client secret>'
    AZURE_TENANT_ID: '<your azure tenant id>'
    DIGITALOCEAN_TOKEN: '<your digitalocean token>'
    STACKQL_GITHUB_TOKEN: '<your github personal access token>'
    GOOGLE_APPLICATION_CREDENTIALS: '/opt/stackql/config/google-credentials.json'
  extraSecrets:
    google-credentials.json: |
      <full google json key>

superset:
  init:
    adminUser:
      password: 'mypassword'
Expand templates and deploy locally
Here we will set up and expose a local dashboard using the local kubernetes cluster supplied with docker desktop.
These steps assume that your kubectl config is pointed at your local cluster (depending on your version of docker, something like kubectl config use-context docker-desktop should do the trick) and that you execute from the root directory of the stackql-cloud repository. We will let the system dynamically assign a local port.
helm dependency update  helm/stackql-dashboards

helm template --release-name v1 --namespace default --set superset.service.type=NodePort --set superset.service.nodePort.http="" -f helm/stackql-dashboards/secrets/secret-values.yaml helm/stackql-dashboards > helm/stackql-dashboards/out/stackql-demo-dashboards.yaml

kubectl apply -f helm/stackql-dashboards/out/stackql-demo-dashboards.yaml
Log into and set up superset
Allow a minute or so for init actions to complete.
First, inspect the output of kubectl get svc and note the host port for the service v1-superset. In my case, I see (redacted):
$ kubectl get svc | grep NodePort
v1-superset                  NodePort    ...    ...        8088:31930/TCP   ...
So, my local port is 31390 on this occasion. Hereafter let us refer to this port as <SUPERSET_LOCAL_PORT>.
Go to your browser address bar and punch in http://localhost:<SUPERSET_LOCAL_PORT>. Log in using admin / mypassword (or other if you reconfigured), and then you can begin using superset.
From the top RHS Settings dropdown, select Database Connections. Then, select the + DATABASE button (just below Settings) and do the following (the password does not matter in this context, add anything you want):
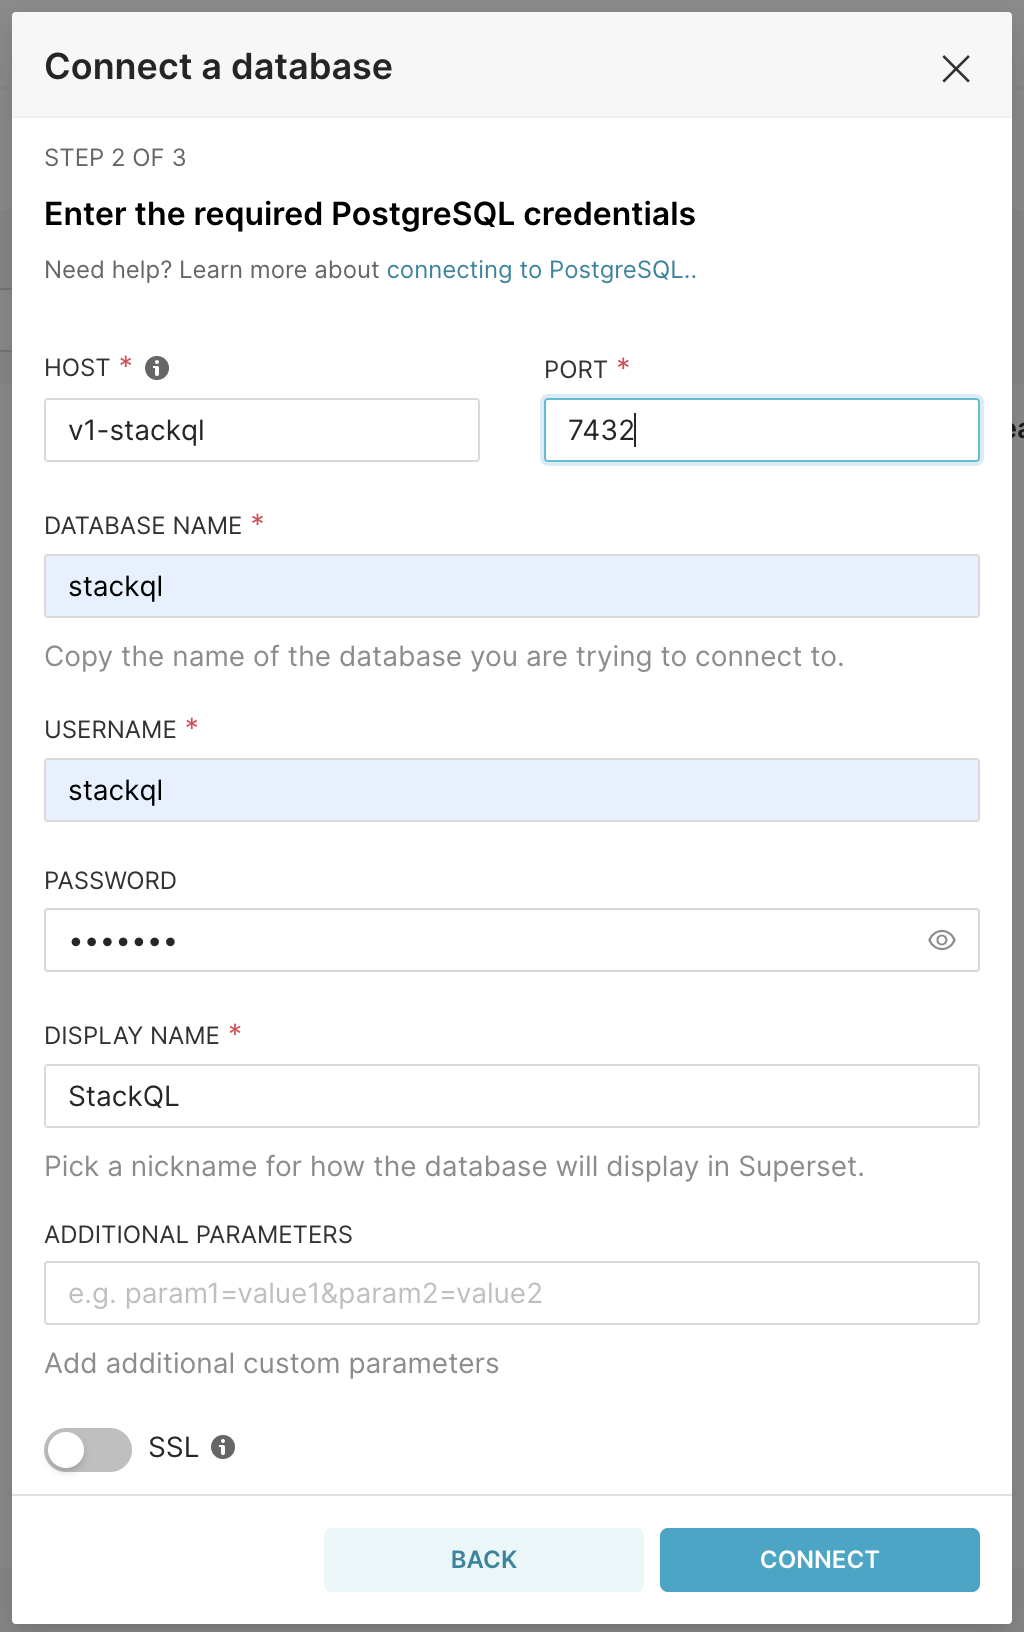
Press "CONNECT"
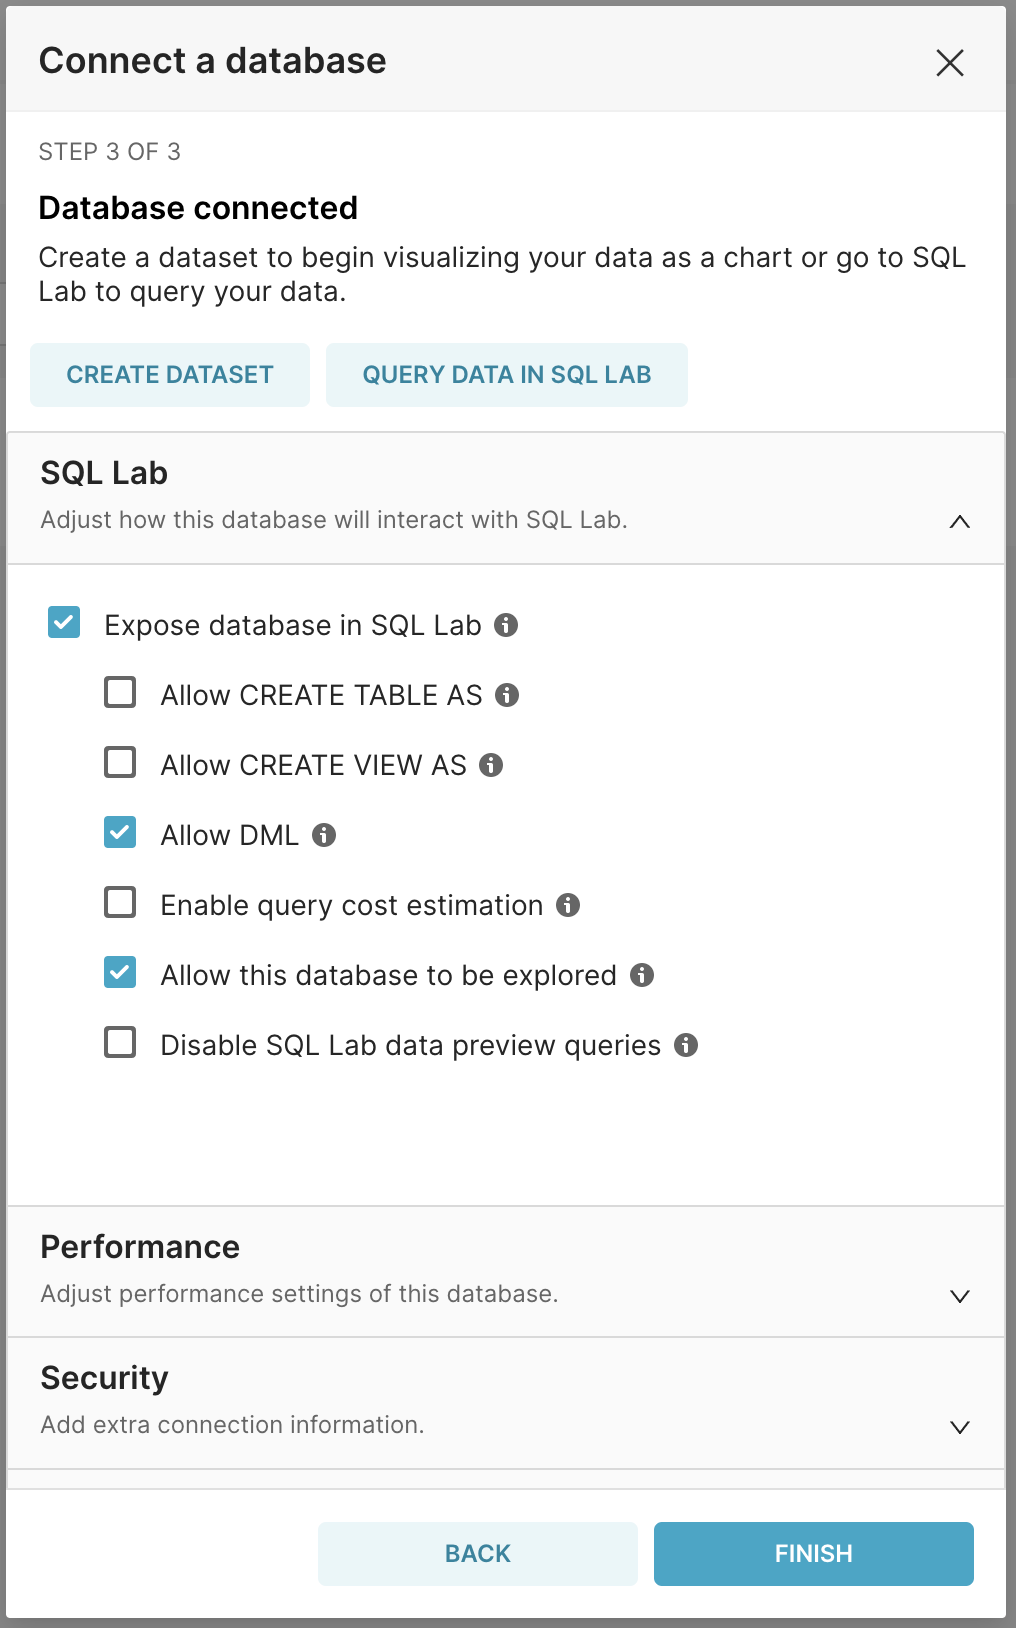
Press "FINISH"
NOTE: we have enabled DML here so that meta queries like show and describe will work. You certainly do not have to do this if you don't want to.
Experiment
Here we present a simple GCP scenario; you can follow the same pattern to create many charts and populate a dashboard...
Navigate to SQL > SQL Lab and then input the below, substituting <your gcp project> for whatever google project your service account can access:
select name, guestCpus from google.compute.machine_types where project = '<your gcp project>' and zone = 'australia-southeast1-a';
Press "RUN SELECTION"
A table of results should appear.
Press "Save" > "Save Dataset"
Give it whatever name you want.
You can click the option to create a chart immediately or navigate to your chart via the Charts menu item.
Once inside the UI for your new dataset, do something like this (we will leave it to your creativity)...
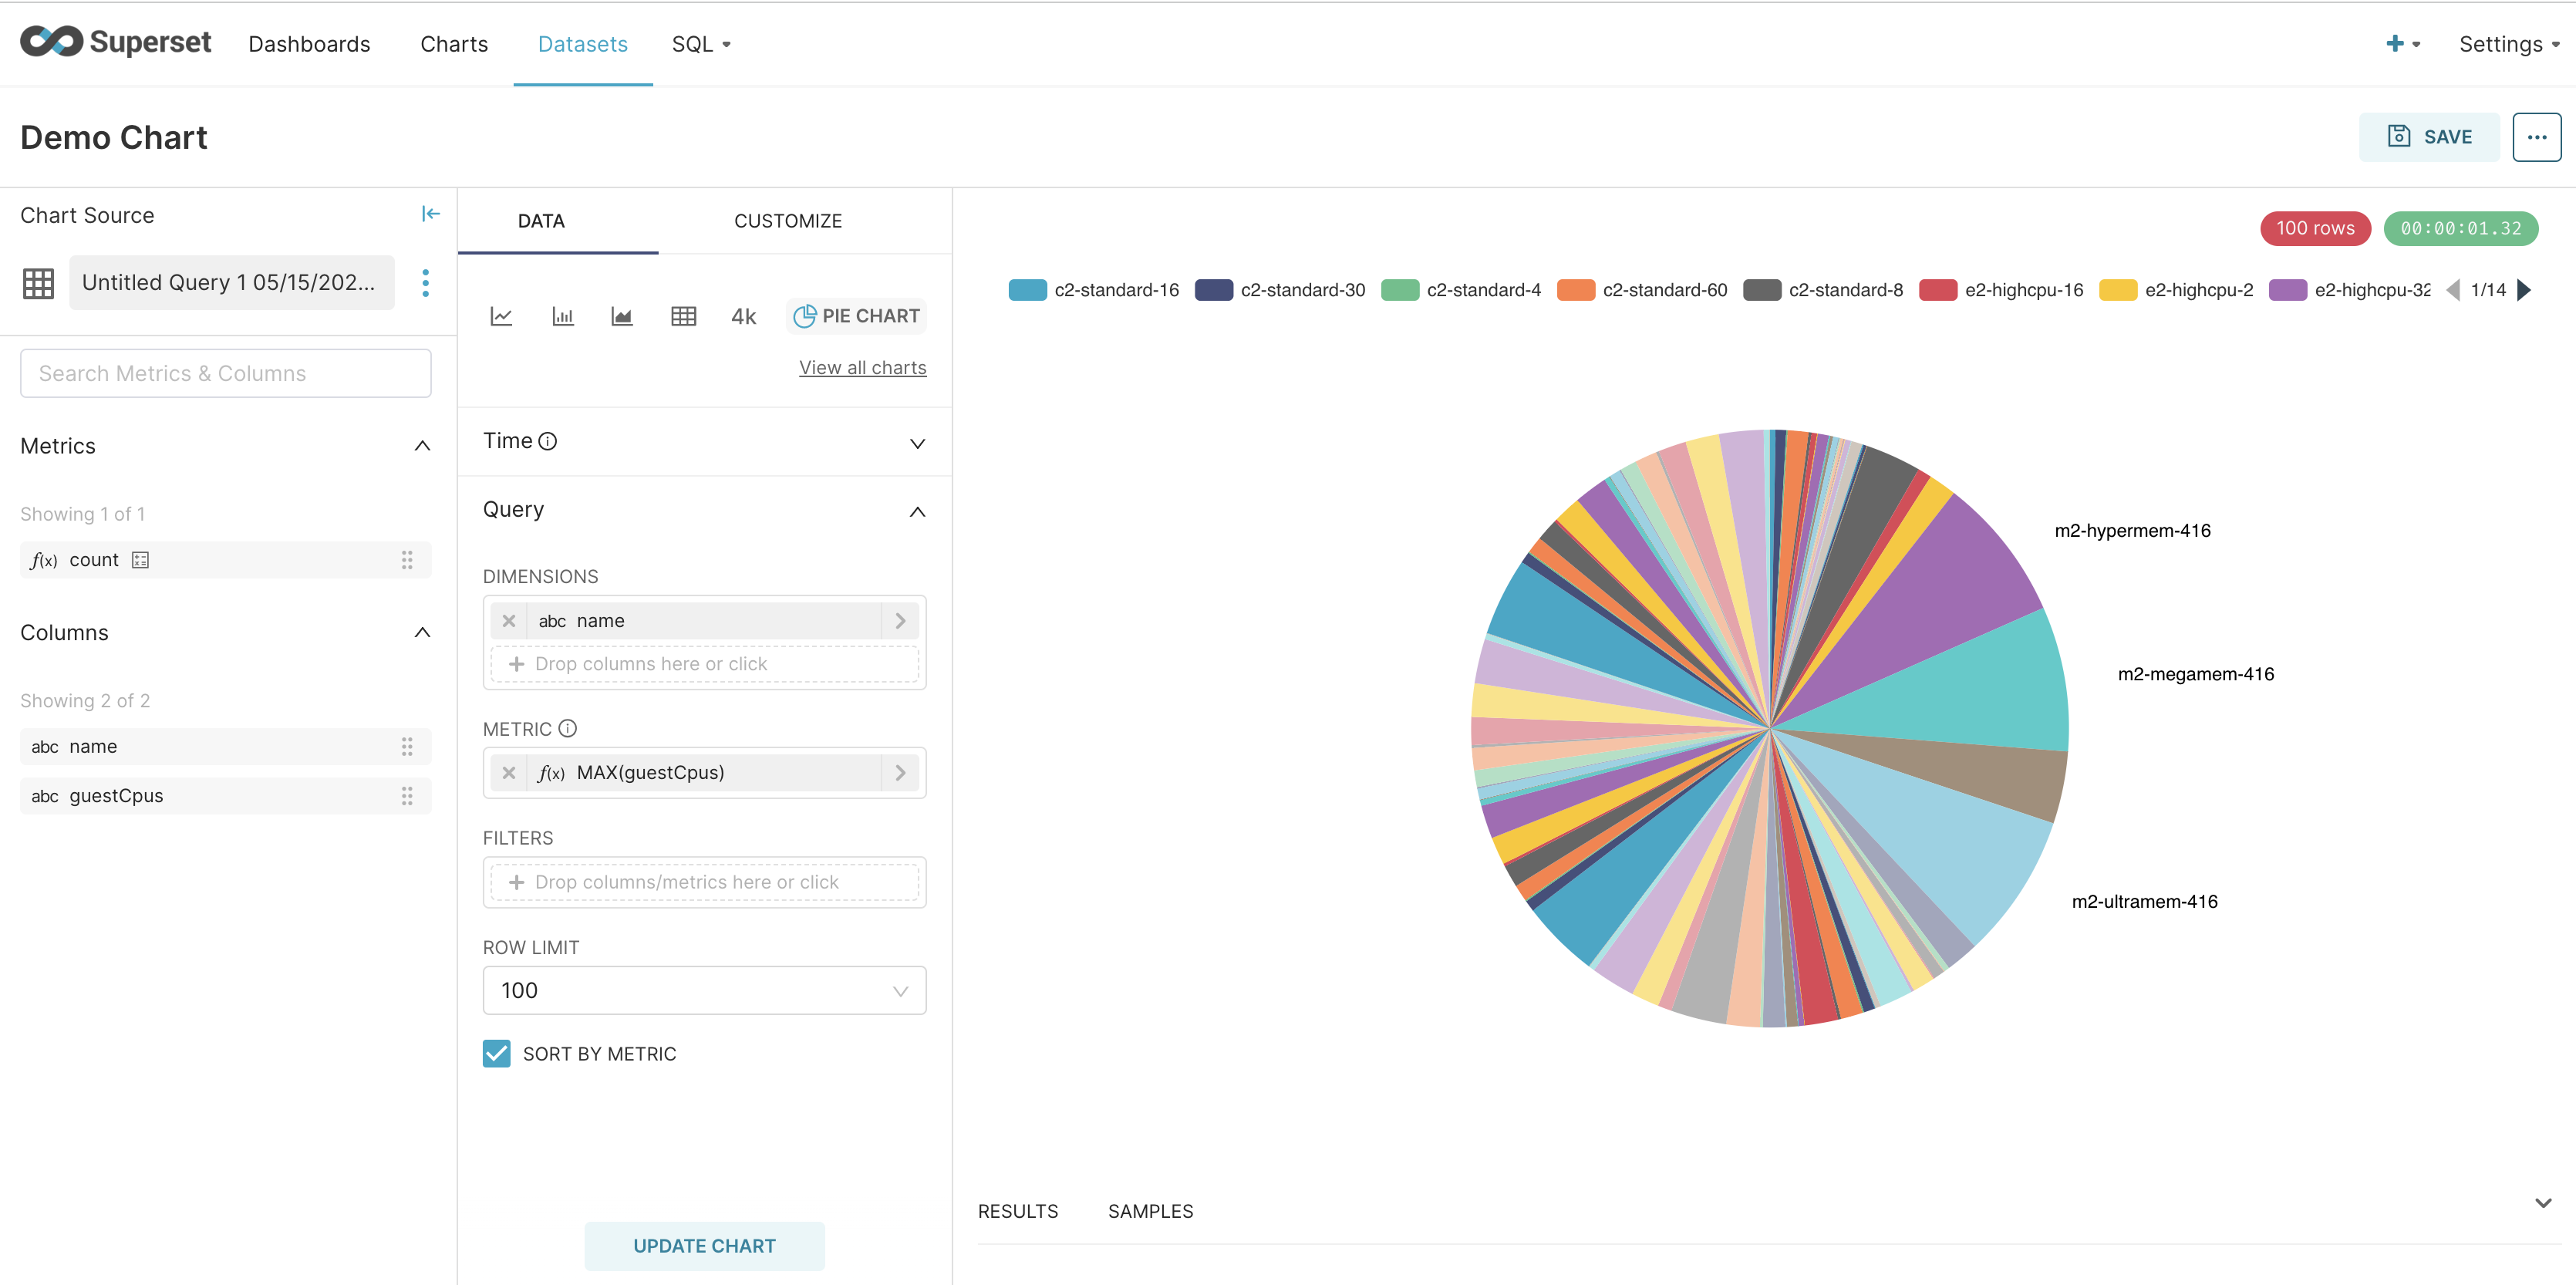
...and then...
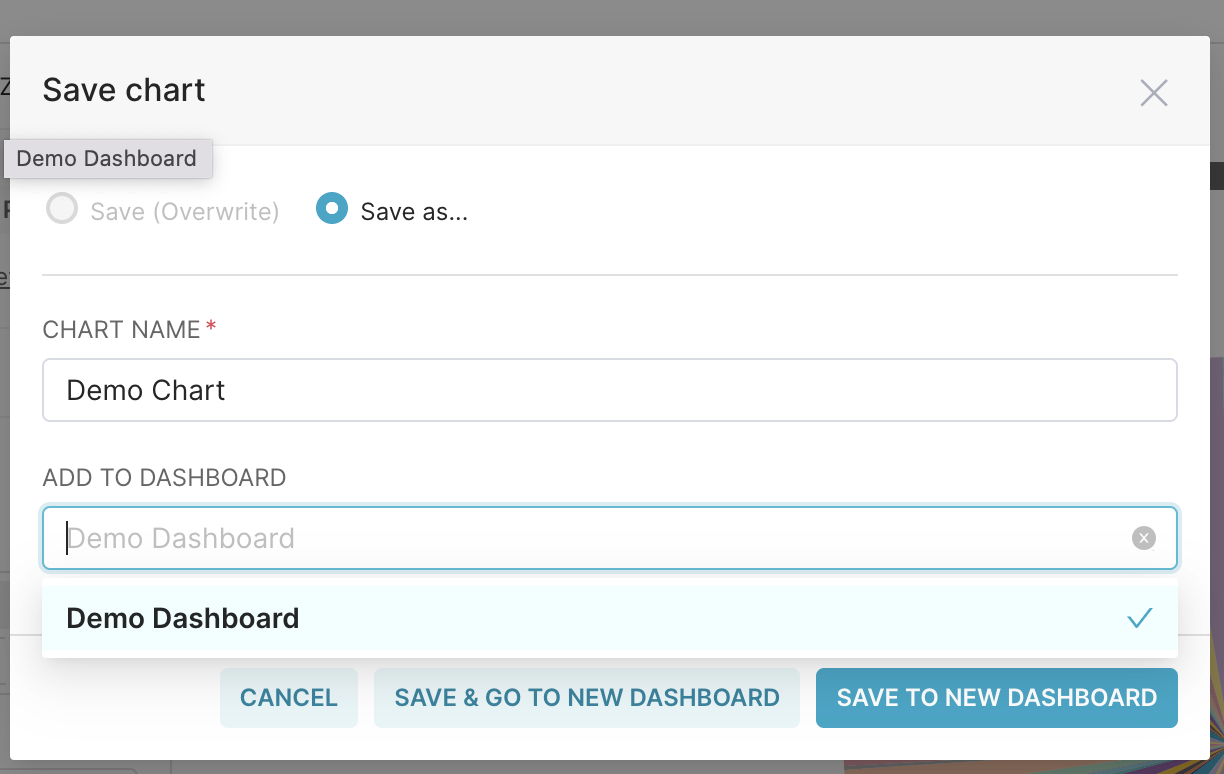
Click on "SAVE & GO TO NEW DASHBOARD", and you have your first dashboard + stackql!
